The Failure Mode No One Talks About
Every platform team has experienced this: dashboards cover the walls, alerts fire constantly, and yet when a real incident hits, it still takes hours—and multiple engineers—to find the root cause. The telemetry exists. The tools are running. But the outcome—fast, confident debugging—remains elusive.
The pattern is predictable. Logs live in one system, metrics in another, traces in a third. Alerts trigger on symptoms, not causes. Context is missing: which tenant, which request, which deployment. Engineers spend more time correlating data across tabs than actually diagnosing problems.
This is the central truth: observability is a system, not a tool purchase. Tooling only reduces incidents when it changes how teams instrument, alert, and respond. Otherwise, you’ve built expensive infrastructure that doesn’t change outcomes.
Observability vs. Monitoring
These terms are often conflated. They shouldn’t be.
Monitoring answers known questions. Is the database up? Is CPU above a threshold? Is the error rate within bounds? You define checks in advance based on failure modes you already understand.
Observability answers unknown questions. Why did latency spike for 2% of users in region X between 14:00 and 14:07? You don’t predefine this query—you explore high-quality telemetry to discover patterns you didn’t anticipate.
The three pillars—metrics, logs, and traces—form the foundation:
Metrics show system state over time.
Logs capture discrete events with detail.
Traces follow requests across service boundaries.
Modern stacks often add two more signals:
Events (deployments, feature flags, config changes) to correlate behavior with change.
Profiles (CPU/memory hotspots) to debug performance regressions that telemetry alone can’t explain.
None of these signals are useful in isolation. The value emerges from correlation.
What Good Telemetry Looks Like
Quality telemetry has structure and discipline.
Naming and field consistency
Naming conventions matter more than most teams expect. When one service logs user_id, another logs userId, and a third logs customer_id, correlation breaks. Establish naming standards early and enforce them in code review. Where possible, follow consistent semantic conventions so every service speaks the same telemetry “language.”
Context propagation is non-negotiable

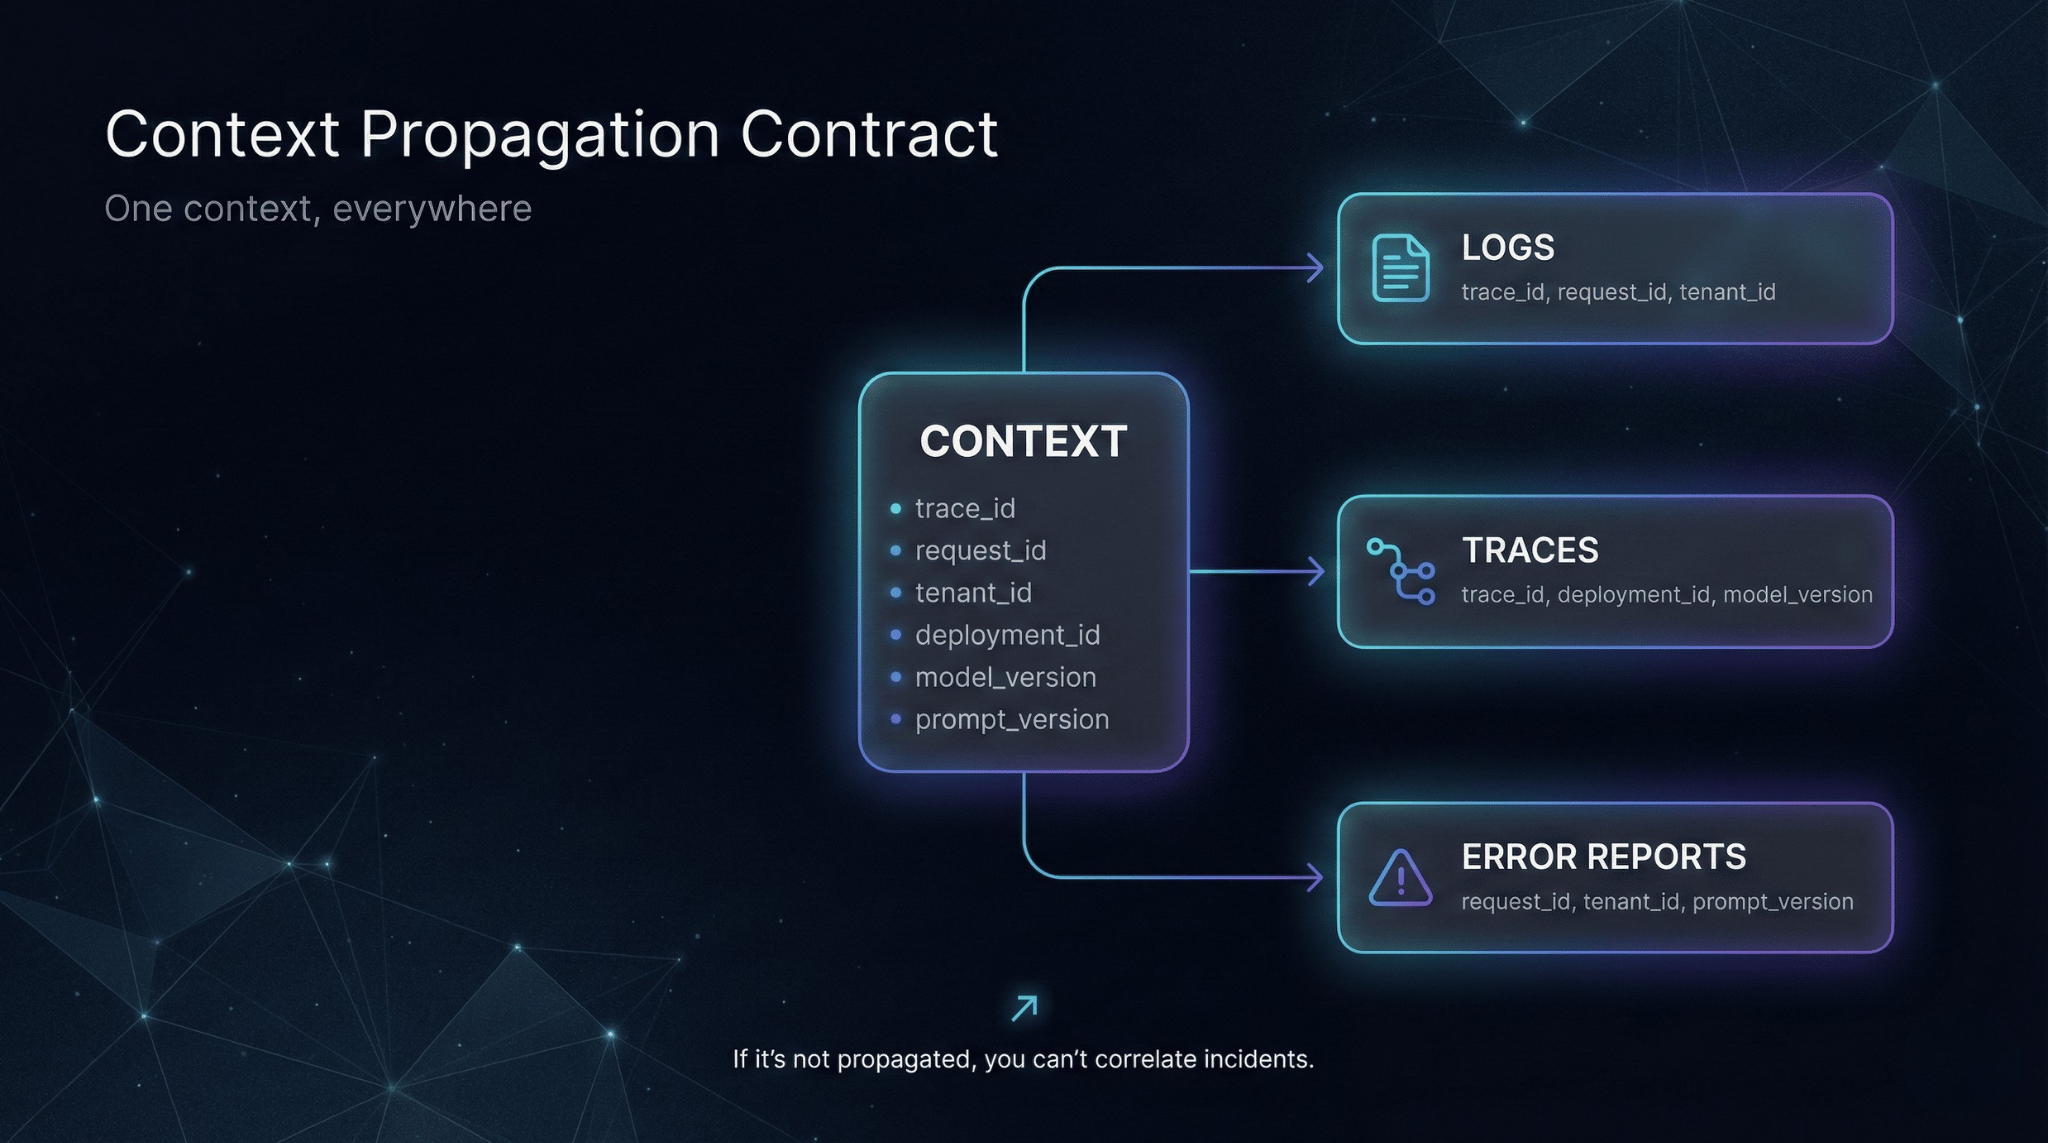
Every request should carry a trace_id and request_id that appears in logs, traces, and error reports. For multi-tenant systems, include tenant_id. For AI systems, include model_version and prompt_version—these become essential when behavior changes after an update.
If you run AI workloads at scale, consider adding lightweight signals that help debug quality and cost regressions:
inference_cost(or cost proxy) per requestoutput quality sampling flags (e.g., “sent to review”)
confidence or score distributions (if your system produces them)
Cardinality control
Cardinality determines your observability bill. A metric dimension with unbounded values (like user_id or request_id) can explode costs and break backends. Use high-cardinality identifiers in logs and traces, not metric labels. Metrics should stay aggregated and stable.
Sampling strategy
Sampling determines what you keep—and what you can debug later. A practical default is head-based sampling for baseline coverage, combined with tail-based sampling for high-value traces (errors, high latency, or specific endpoints). Tail sampling is often more useful during incidents because it preserves the traces you actually care about, but it requires clear criteria and capacity planning. Treat sampling as an engineering control, not a cost hack.
Security and PII redaction
Telemetry systems often become accidental PII stores. Redact sensitive fields at collection time, not after ingestion. Apply access controls and audit logs to your observability data—especially in multi-tenant or regulated environments.
Tooling Components: A Stack View
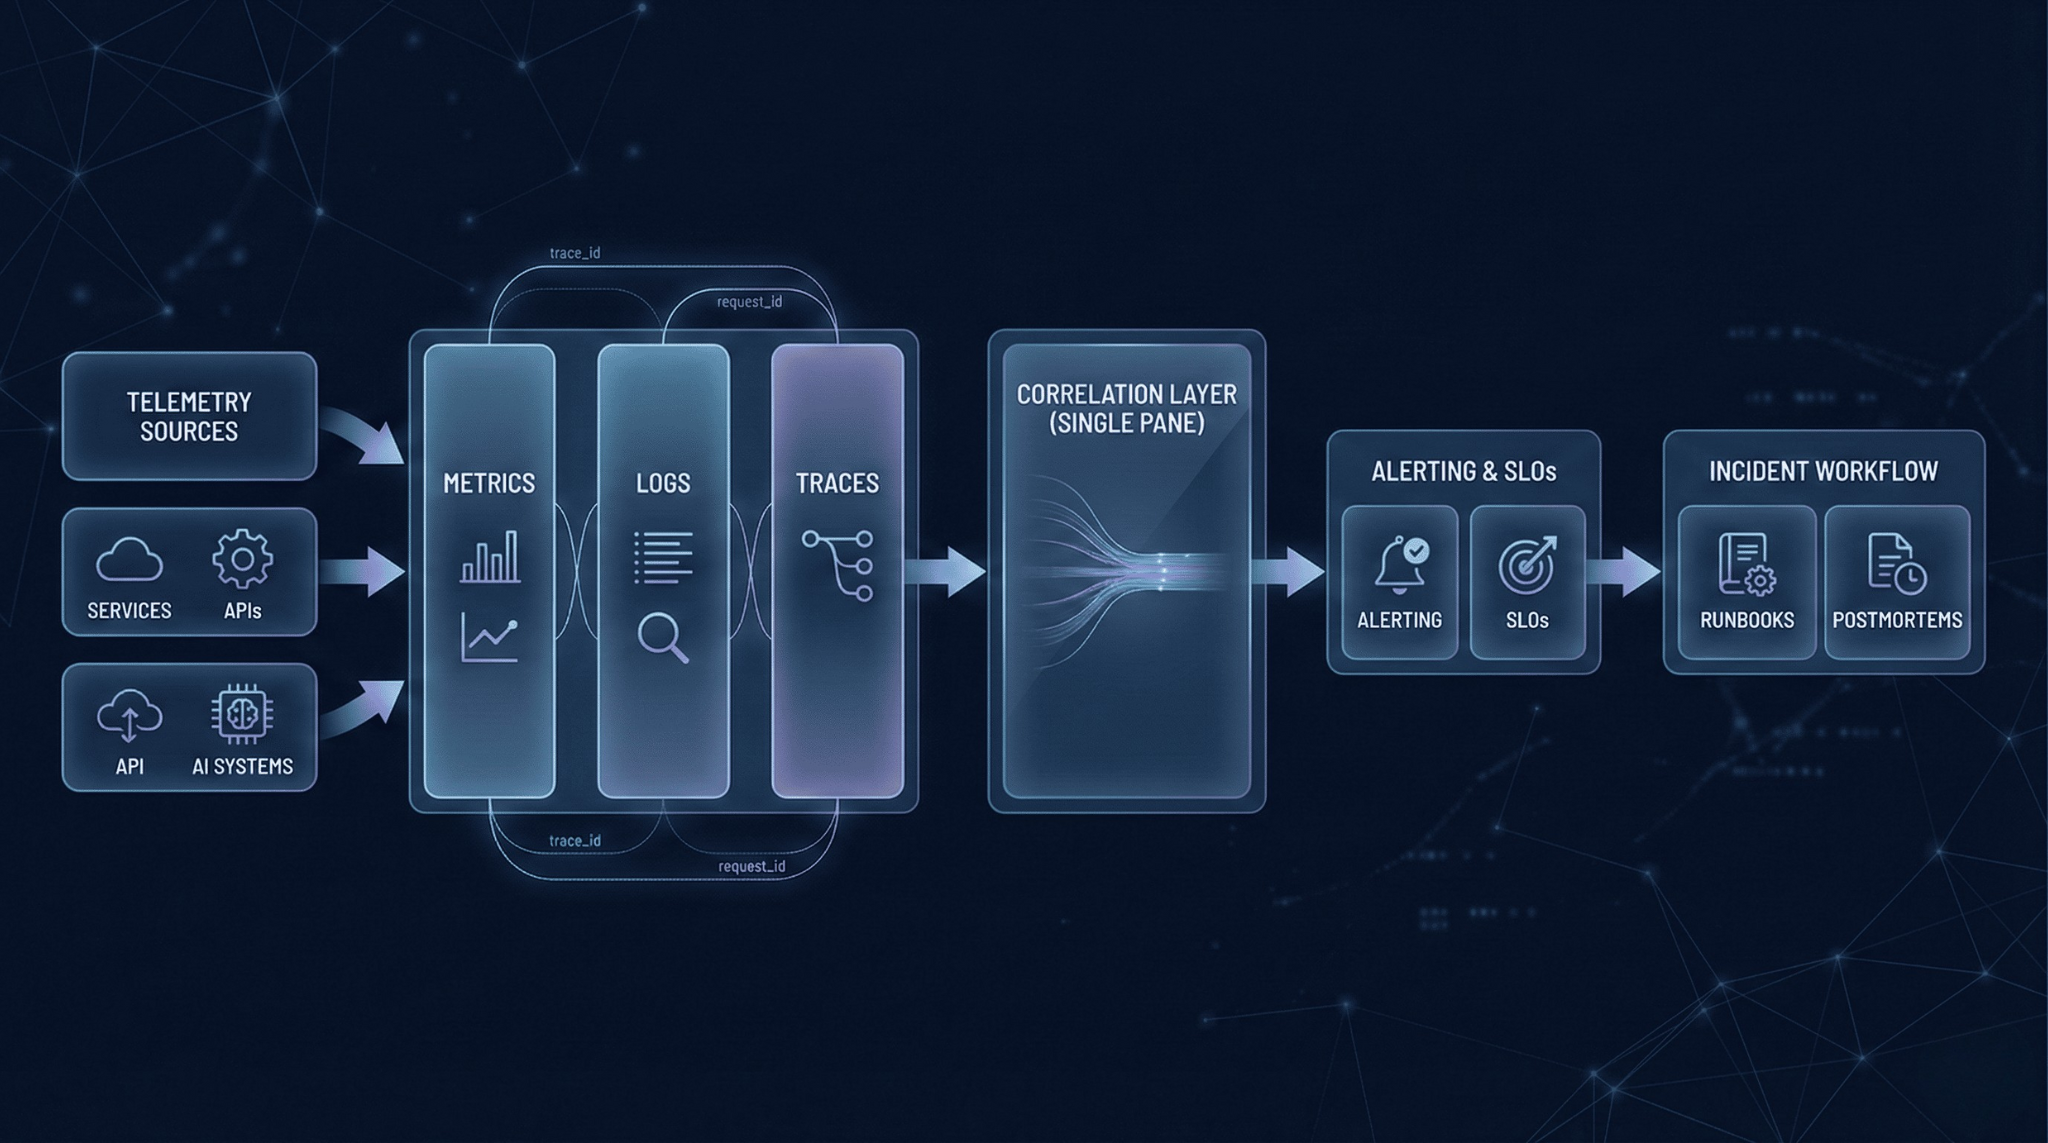
A production observability stack usually has five layers.
Collection and agents
Instrumentation libraries and collectors gather telemetry from applications and infrastructure. A vendor-neutral collection layer (conceptually aligned with OpenTelemetry principles) helps standardize instrumentation and reduce rework when backends change.
Storage backends
Metrics typically go to a time-series store. Logs go to an indexed log store. Traces go to a trace store. Some platforms unify these; others keep them specialized. The trade-off is cost, performance, and operational complexity.
Query and correlation
This is where engineers spend their time during incidents. The critical capability is linking traces to logs to metrics in a single workflow—clicking a trace span and immediately seeing the corresponding log lines and relevant time-series context.
Alerting and routing
Alerting is how signals turn into pages. This includes alert definitions, escalation policies, on-call schedules, and routing rules. The goal is not “detect everything.” The goal is to page only when user impact is likely and action is clear.
Incident workflows
Runbooks linked to alerts, postmortem processes, and ownership records. Even perfect telemetry is wasted if no one knows who owns the failing service or how to respond safely.
How to Choose Tools (Decision Criteria)
Evaluate observability tooling against criteria that map to outcomes.
Correlation capability
Can you navigate from a trace to its logs to relevant metrics without tool-switching or manual ID searches?Cost and cardinality economics
How does pricing scale with volume and label cardinality? Model your realistic workload—especially peak events, not average days.Instrumentation experience (developer workflow)
How much code change is required? Do SDKs exist for your languages/frameworks? Can teams instrument consistently without heroics?Stack reliability
Is your observability stack itself observable? What happens when ingestion fails during an incident? How quickly do you detect and recover?Security and compliance
Does it support PII redaction, access controls, and audit logging? Can you enforce tenant isolation where needed?Scale and multi-tenancy
Can it handle your growth trajectory and data volume without constant re-architecture?Portability and lock-in
Can you export data or switch backends without re-instrumenting everything? A portable collection layer reduces long-term risk.AI-specific support (if relevant)
Can you track model/prompt versions and cost per request? If you sample outputs or track quality signals, can you store and query those safely?
Implementation Roadmap (Staged, Practical)

Observability improves outcomes when it’s rolled out as a discipline, not a migration project.
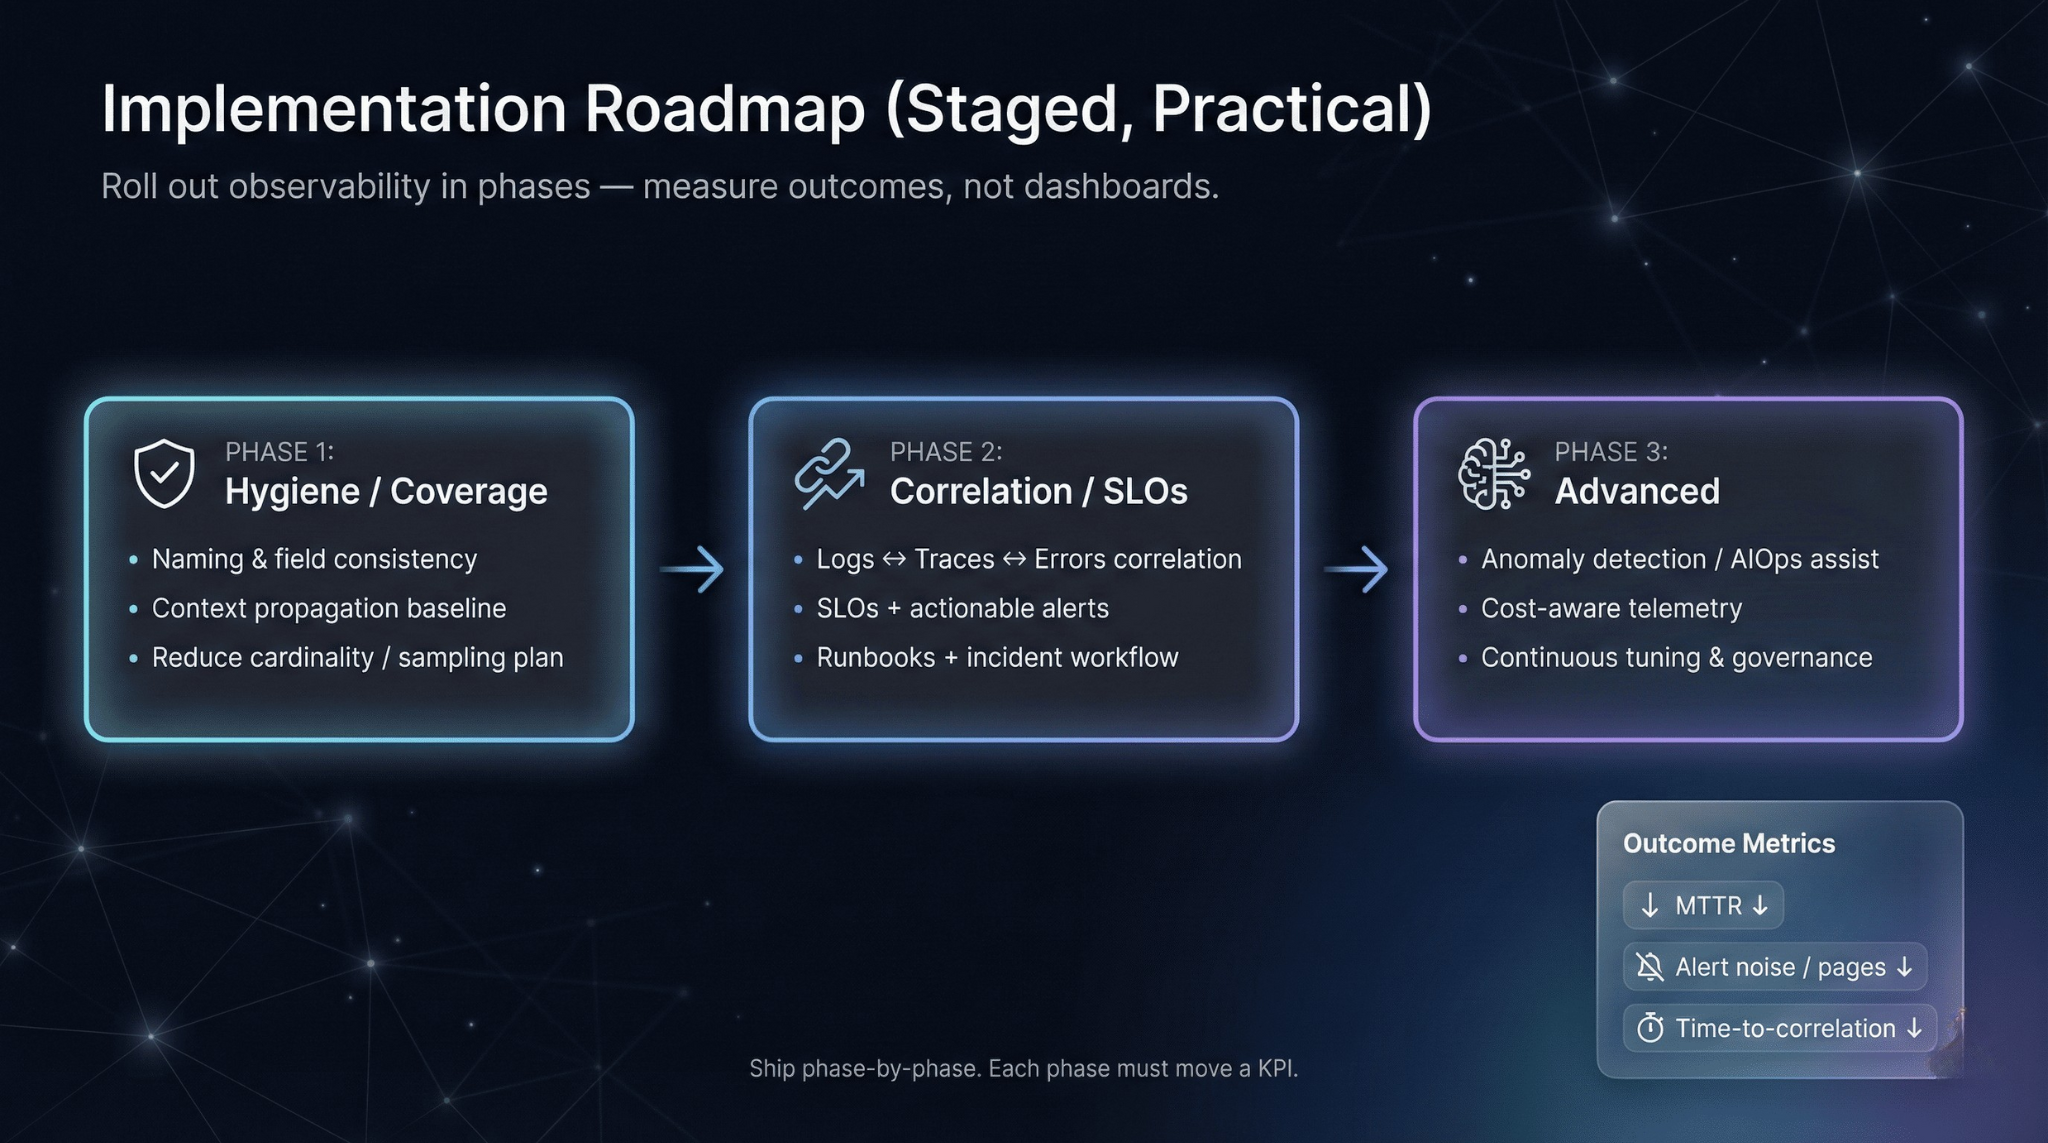
Phase 1: Hygiene and coverage
Instrument your five most critical services with structured logging and basic metrics. Establish naming conventions. Deploy a unified collection pipeline. Ensure consistent trace_id propagation across these services—even before full distributed tracing.
Phase 2: Correlation and SLOs
Add distributed tracing with cross-service context. Define SLOs for user-facing journeys and alert on burn rate, not raw thresholds. Link alerts to runbooks. Assign service ownership explicitly.
Phase 3: Advanced capabilities
Implement tail-based sampling for cost efficiency and higher-quality incident traces. Add continuous profiling for performance debugging. Explore anomaly detection for baseline deviations. Integrate deployment events so releases and config changes are visible in timelines.
Start small. Enforce conventions before adding complexity. Measure outcomes—MTTR, alert noise, time-to-correlation—not just telemetry coverage.
Scenario: Before and After
Before: A payments team runs 40 microservices. Incidents average 2.5 hours to resolve. On-call engineers face 15+ alerts per week, most non-actionable. Debugging requires searching logs in one tool, checking dashboards in another, and asking in Slack who deployed what.
After: Trace-linked logs reduce correlation time from 45 minutes to under 5. SLO-based alerting cuts weekly pages from 15 to 4, all actionable. Deployment markers in dashboards immediately surface suspect releases. MTTR drops to 35 minutes (illustrative).
The tooling didn’t change dramatically. The discipline did.
Production Checklist
Verify
trace_id/request_idpropagate end-to-end and appear in logs and tracesEnforce a shared field schema and naming conventions across services
Keep high-cardinality identifiers out of metric labels; use logs/traces instead
Define SLOs for critical journeys and alert on burn-rate (not raw thresholds)
Ensure every alert has an owner and links to a runbook (including rollback steps)
Apply PII redaction at collection time with access controls and audit logs
Monitor the observability stack independently (ingestion, storage, query, alerting)
Closing: Principles Over Products
Observability reduces incidents only when it changes behavior. Better instrumentation means context is available by default. Better alerting means pages are tied to user impact and SLOs—not noise thresholds. Better ownership means the right person responds with a runbook and a safe path to rollback.
Tooling enables these outcomes, but doesn’t guarantee them. The teams that get value from observability treat it as an engineering discipline: conventions, code review, regression thinking, and continuous improvement.
The goal isn’t more data. It’s faster answers—reliably, during the worst day in production.